The journey of The Unity to Africa and the Caribbean can be followed via the interactive map. Read more about:
- The dots on the map
- The text balloon showing date and location
- The colors of the dots
After opening the blog, a special map of the Atlantic Ocean can be seen. It is a so-called West Indies nautical chart, with which sailors could sail from Europe to Asia or make the crossing over the Atlantic Ocean to America. This copy is made on parchment and dates from the end of the 17th century. The map is owned by the Norman B. Leventhal Center at the Boston Public Library, Massachusetts, United States.
The chart is perfect for depicting The Unity’s itinerary. In the 18th century, however, the helmsmen made much more use of sub-maps, depicting parts of coasts and the Atlantic Ocean.
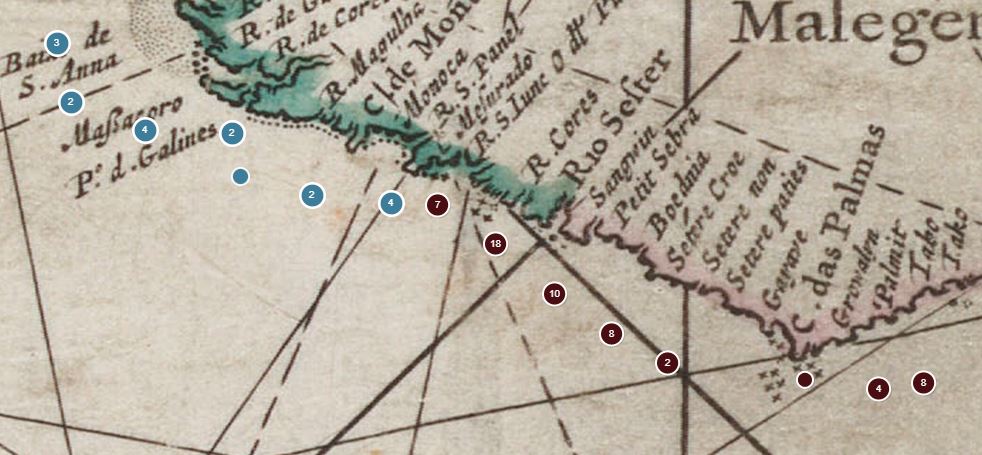
The Dots on the Map
The route of The Unity is marked with dots on the map. The dots split or merge when you zoom out or zoom in on the map. A number in a bubble indicates the number of days. The zoom in and out buttons are located at the top left of the screen. Zooming in and out is also possible by scrolling.
The map can also be dragged by holding down the left mouse button and moving the mouse.
Below the zoom buttons is a button to go to the route on the current OpenStreetMaps map.
Text Balloon Showing Date and Location
After clicking on a bubble without a number, a speech bubble opens with the date and location of the relevant day. With the button ‘Read more’ the report of the day is opened.
By using the dots, it is possible to open the daily reports of specific days or locations.
The Colors of the Dots
The spheres have a blue or brown color. Blue refers to sea navigation and brown to coastal navigation. The first mate of The Unity, Daniël Pruijmelaar, used both modes of navigation to record the ship’s position in the logbook.
In sea navigation, the first mate has noted the position in latitude and longitude. The original latitudes and longitudes have been corrected for this blog. An important correction concerns the prime meridian. At that time the prime meridian of the Canary Islands was used, today that of Greenwich, United Kingdom. Another major adjustment concerns the ship’s positions during the ocean crossing. These have been corrected manually, partly on the basis of the logbook.
In coastal navigation, the first mate noted the visually visible points on land. On the basis of this data, the modern coordinates were found.
The map therefore accurately reflects the course of the journey, but does not indicate the exact positions of the ship. The navigation tools of the time were too limited for that.

West-Indian map by Hendrick Doncker
Collection: Norman B. Leventhal Center in the Boston Public Library. Map Reproduction Courtesy of the Norman B. Leventhal Center at the Boston Public Library.
Daily reports are displayed as interactive dots on the map.
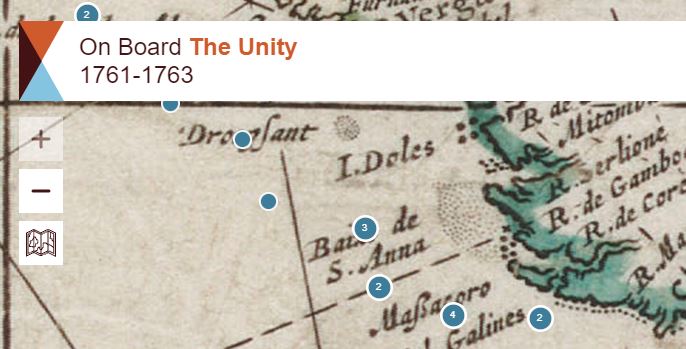
In the top left corner are buttons for zooming in and out, and for changing the map from historical to current or vice versa
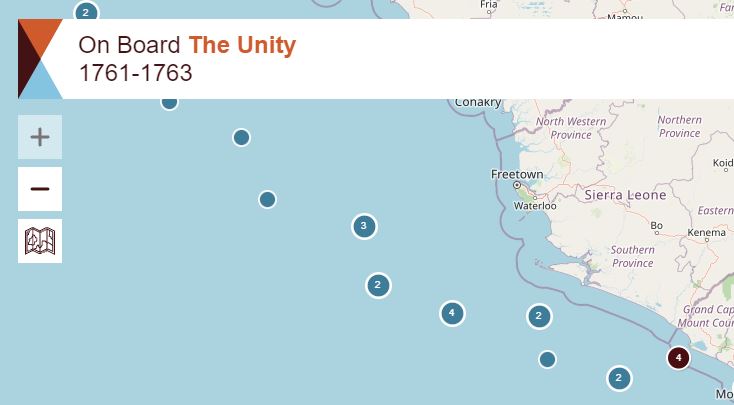
Display of the current map (Open Streetmaps).
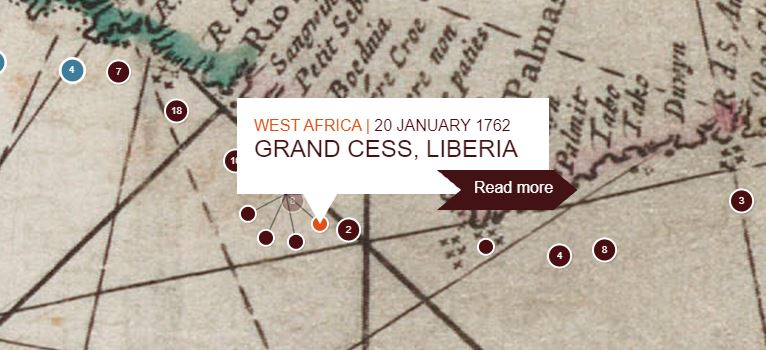
The speech bubble of a daily report shows location and date of the ship.